In the EU, women's average gross hourly earnings were 12.0% lower than men's in 2023, and the euro-area gap was 12.3% (European Commission gender pay gap statistics). That single benchmark is enough to change the conversation, because it shows the gender pay gap is not a noisy one-year anomaly, it's a structural measurement problem that HR has to define with precision.
The core issue behind gender pay gap definizione is statistical discipline. The gender pay gap measures the earnings difference between women and men, but the result changes depending on whether you use hourly or annual pay, mean or median earnings, and whether you include all employees or only full-time workers (OECD gender wage gap definition). If leaders blur those definitions, they end up comparing numbers that answer different questions, then mistake that confusion for inconsistency in the workforce.
Understanding the Gender Pay Gap Definition
The European benchmark spans -0.9% in Luxembourg to 19.0% in Latvia, a difference of 20.0 percentage points across the EU statistical coverage and methodology (European Commission gender pay gap statistics). That range shows why HR leaders need to define the metric before interpreting it. A single figure can describe a workforce pattern, but it cannot identify the mechanism producing that pattern.
A precise gender pay gap definition also prevents a common analytical error. The indicator does not, by itself, prove that two people performing the same job received different pay. The OECD defines the gender wage gap as the difference between men's and women's median earnings, expressed as a percentage of men's median earnings, with the standard measure based on unadjusted gross earnings among full-time wage and salary workers (OECD gender wage gap definition).
Why terminology changes the business decision
An unadjusted gap compares the pay outcomes of women and men across the workforce as it exists. It therefore captures the combined effect of job distribution, seniority, working patterns, progression, and pay decisions. That makes it an accountability metric for the organization's overall outcome.
An adjusted gap asks a narrower question. After accounting for factors such as job family, level, location, or working time, does a difference remain among broadly comparable employees? The adjustment can support targeted investigation, but it depends on the variables selected and on how consistently the organization classifies roles. A small adjusted gap does not cancel a large unadjusted gap. The two measures answer different questions and should be reported together.
Practical rule: label every dashboard value by its measurement basis, then separate the workforce-level gap from the equal-pay review. This keeps accountability visible without claiming that one statistic establishes unlawful unequal pay.
For HR leaders, the phrase the gender pay gap definition should become a reporting standard. State whether the figure uses median or mean earnings, hourly or annual pay, full-time or all employees, and gross or other compensation. Record whether it is unadjusted or adjusted, and list the comparison variables used. Consistent labels prevent mixed definitions from creating false alarms or false reassurance.
Internal reporting should also align with disclosure expectations. The EU pay transparency directive and Italy provides a European reference point when internal terminology must match external reporting. The metric should guide the diagnostic sequence, not replace the underlying pay review.
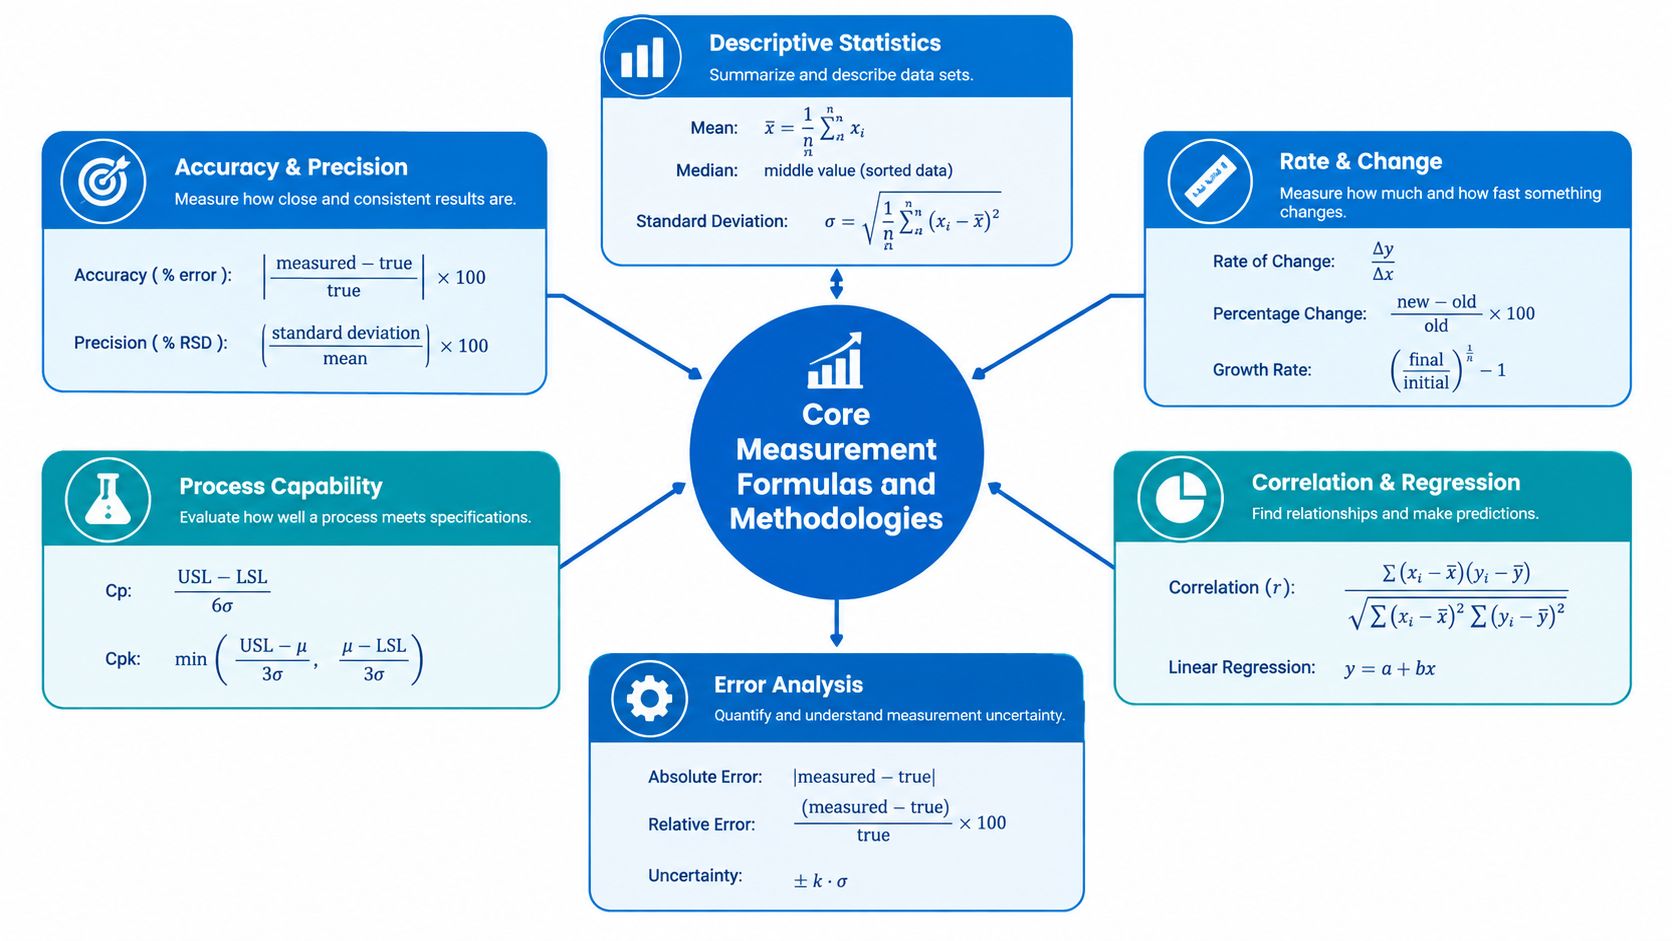
Core Measurement Formulas and Methodologies
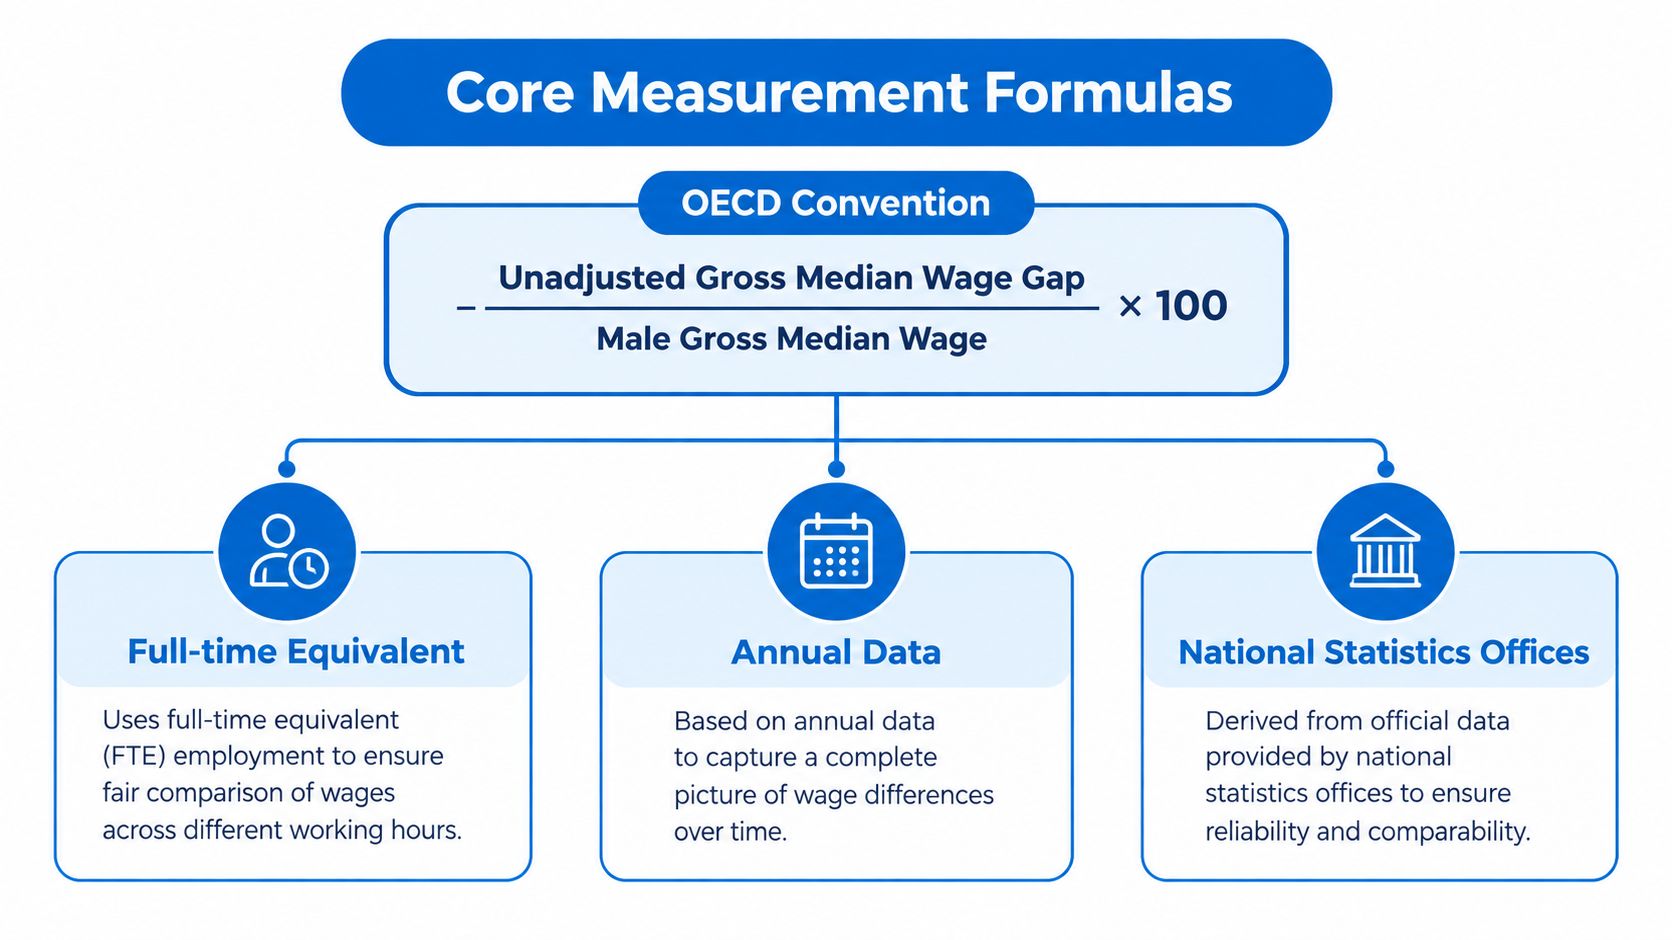
A gender pay gap can look precise while resting on incompatible definitions. The standard formula is (Em – Ew) / Em × 100, with men's earnings in the denominator and women's earnings as the comparison value (OECD gender wage gap definition). The result therefore represents women's earnings as a percentage difference from men's earnings. It is not a symmetric ratio.
Median versus mean is not a cosmetic choice
The OECD convention generally uses unadjusted gross median earnings of full-time wage and salary employees (OECD gender wage gap definition). Median earnings identify the midpoint of the pay distribution. They are less affected by a small number of very high salaries, which can pull the mean upward and make the typical employee appear better paid than the central observation indicates.
Mean earnings remain useful for showing the total distribution and the influence of highly paid roles. HR analysts should therefore record the chosen measure rather than treating median and mean as interchangeable. A difference between them can signal concentration at the top, uneven representation across levels, or a pay distribution that warrants further review.
The ILO uses a related convention based on average hourly earnings, comparing women's and men's hourly pay and expressing the difference as a percentage of men's hourly pay (the OECD comparison of ILO hourly-earnings methodology). An hourly measure can reduce distortion from different working schedules, while annual earnings capture the combined effect of hours, bonuses, and other pay components. Two reported gaps can therefore differ because their populations, time bases, or compensation scopes differ.
What to label in an HR dashboard
A dashboard should identify the measurement basis before displaying the result. Use labels such as median full-time unadjusted gap, hourly mean gap, or annual earnings gap, then state whether the population includes all employees or only full-time staff.
- Metric basis: Specify hourly, monthly, or annual pay.
- Population coverage: State whether part-time and full-time employees are included.
- Central tendency: Identify mean or median.
- Earnings scope: List base salary, bonuses, variable pay, or other included components.
- Adjustment status: Mark the result as unadjusted or adjusted, and name the variables used in any adjustment.
For implementation guidance, consult this calculation guide for the gender pay gap. Clear labels let HR leaders use the unadjusted measure for workforce-level accountability and adjusted analyses for targeted investigation, without treating either figure as a complete equal-pay finding.
Unadjusted Versus Adjusted Pay Gap Analysis
An unadjusted gap shows the overall earnings difference across the workforce or labour market. An adjusted analysis compares workers after accounting for observable characteristics that may influence pay. These measures answer different management questions: the unadjusted figure supports accountability for the organization's outcome, while the adjusted figure helps identify where comparable-role differences require investigation.
What each metric can and can't tell you
An adjusted gender pay gap controls for measurable factors such as education, age, full-time or part-time status, and public or private-sector employment. It then combines subgroup-specific gaps using weights, following the ILO factor-weighted method in the verified data. This can reduce composition bias when women and men are concentrated differently across senior, specialist, or higher-paid roles.
The model's controls determine the question it answers. If analysts include occupation, grade, or job level, and access to those positions has been shaped by unequal opportunity, the adjusted result may remove part of the inequality HR needs to examine. A remaining gap also does not, by itself, establish discrimination. Omitted variables, measurement error, and earlier career effects can still influence the estimate.
| Metric Type | Primary Use Case | Key Limitation |
|---|---|---|
| Unadjusted gap | Board reporting, external accountability, labour-market monitoring | Combines pay-setting effects with occupational segregation and working-time patterns |
| Adjusted gap | Internal diagnostics, comparable-role review, remediation targeting | May conceal structural inequality when controls reflect unequal opportunity |
Use both measures, with separate governance purposes. The organization-wide figure keeps accountability visible and shows the outcome employees experience. The adjusted within-role or within-level result supports targeted review of grading, promotion access, starting pay, and local pay-setting decisions. Relying on the adjusted figure alone can make a structural problem appear smaller. Relying only on the unadjusted figure can obscure which decisions require correction.
Role definitions also affect comparability. Employment frameworks and courts may assess the substance of work rather than job titles or administrative labels. This how the Court of Appeal ruled provides an external illustration of that reasoning.
Diagnostic rule: publish the unadjusted figure for accountability, then use the adjusted figure to select investigations into pay bands, promotion criteria, role matching, and variable pay access.
Structural Drivers Behind the Statistics
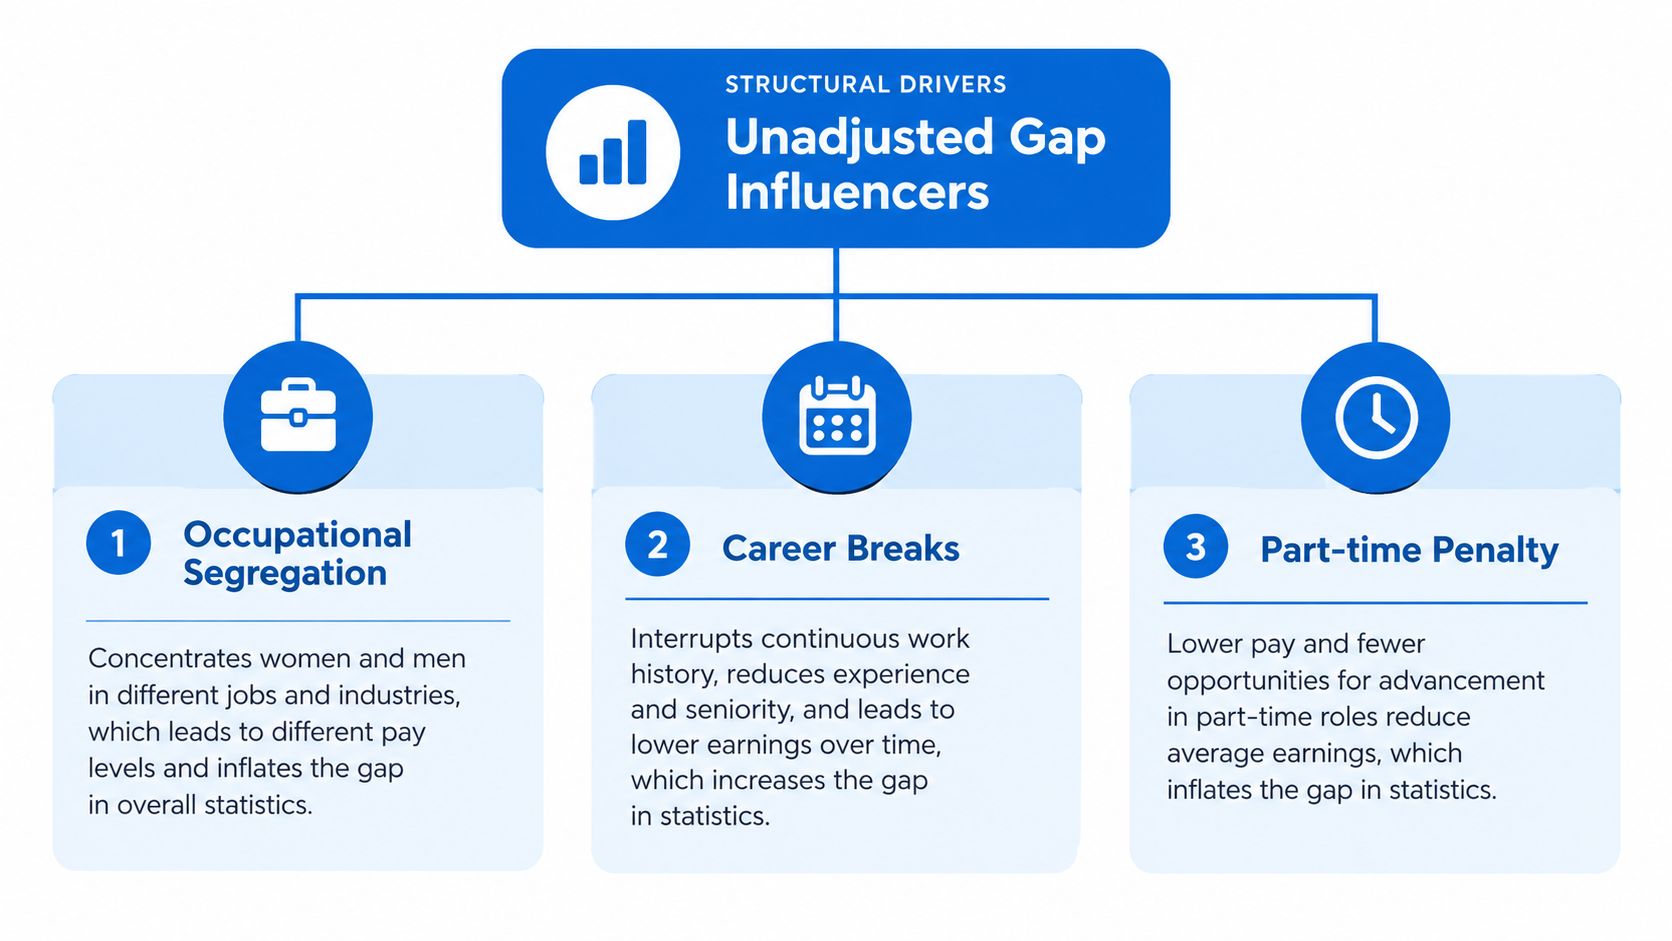
A wide organization-wide gap often persists even after within-role pay issues are corrected. The reason is structural composition. Who is concentrated in revenue-heavy functions, who reaches management grades, who works reduced hours, and who qualifies for bonus-bearing roles will shape the unadjusted result long before HR tests whether two comparable employees are paid the same.
Occupational segregation usually carries more weight than HR teams first expect. If women and men are distributed unevenly across job families, business units, or seniority levels, the aggregate gap will widen even where local pay decisions are broadly consistent. In practice, this means a clean adjusted result can coexist with a large unadjusted gap. That combination does not cancel the problem. It identifies where to look. Representation, progression, and role allocation.
Working-time patterns and career interruptions add a second layer. The broader earnings gap reflects not only hourly pay, but also access to paid hours, continuity of service, and the pace of advancement after leave or reduced schedules. OECD family database material on full-time worker comparisons is useful here because it separates hourly wage comparisons from the wider employment patterns that affect annual earnings. For HR directors, that distinction matters operationally. Base-pay parity does not offset a system in which part-time roles are concentrated in lower-paid tracks or advancement slows after non-linear career paths.
The unadjusted gap is an outcome measure of the whole talent system. The adjusted gap is a diagnostic measure of pay-setting within defined comparison groups.
The EU's broader gender overall earnings gap has been reported as materially larger than the hourly pay gap because it combines three mechanisms: pay per hour, hours worked, and employment participation. Eurostat's dedicated material on the gender overall earnings gap is useful for this reason. It shows why equal-pay remediation on salary bands, while necessary, will not by itself change the full employee outcome if workforce design remains unchanged.
A structural reading changes the intervention sequence. Start by testing where the unadjusted gap is being created: entry point, promotion rates, movement into profit-critical roles, manager span, variable-pay eligibility, and exits after parental leave or flexible work uptake. Then test whether any adjusted within-group gaps remain after those structural patterns are isolated. This order prevents a common analytical mistake. Teams sometimes celebrate a modest adjusted gap while missing the larger allocation problem that employees actually experience.
Role definition also matters. Legal and analytical comparability depends on the substance of work, not only the title attached to it. The external example in how the Court of Appeal ruled illustrates why job architecture must be reviewed carefully before drawing conclusions from either metric.
For HR leaders, the implication is straightforward. Use the adjusted gap to identify pay-setting exceptions that need correction. Use the unadjusted gap to find structural barriers in hiring, progression, flexibility design, and access to premium pay opportunities. Treating one metric as a substitute for the other leads to under-diagnosis.
Executing a Structured Internal Pay Audit
A useful internal audit starts by separating the workforce into meaningful comparison groups before anyone touches the budget. The first pass should segment by job family, level, employment status, location, and pay component, because a blended view can hide the exact pockets where the pay gap sits. That is the difference between a dashboard and a diagnostic tool.
A practical audit sequence
Start with the raw organization-wide gap, then cut it by grade and job family. If the result changes sharply by level, the issue is likely structural rather than purely transactional, which points to progression, hiring, or access to leadership roles.
Next, split the data by employment status and location. Part-time work, site-specific labour markets, and local pay norms can distort the picture if you compare unlike groups. Then separate base pay from variable compensation, because bonuses and incentives often follow different rules from salary bands.
- Job family review: Compare like with like before crossing families, so you do not mask role-specific issues.
- Level review: Check whether the gap expands at senior levels, where access to decision-making roles may be uneven.
- Employment status review: Distinguish full-time and part-time workers, because the same pay rate can still produce different annual outcomes.
- Location review: Identify whether geography is driving the result more than job content.
- Pay component review: Separate base pay, bonus, and incentives so each lever can be fixed properly.
Operational rule: do not approve compensation changes from a blended report. Fixes based on blended data are usually too broad, and they often miss the exact layer where inequality is forming.
A second report should track the wider workforce patterns alongside the pay gap. Promotion movement, role distribution, and access to high-paying positions need to sit on the same HR dashboard as compensation outcomes. Without that pairing, the organization can reduce one metric while leaving the underlying inequality untouched.
Role definitions also need a careful review before any conclusion is treated as final. Legal and analytical comparability depends on the substance of work, not only the title attached to it, so job architecture should be checked with the same discipline as the pay figures themselves. The internal pay equity analysis guide is a useful reference for structuring that review, because it aligns segmentation with the questions a pay audit needs to answer.
One practical software option in this space is Spark, which can calculate adjusted and unadjusted pay gaps by role level and job-value cluster, then surface anomalies and objective justification prompts in reporting workflows.
Strategic Actions for Sustainable Pay Equity
A pay gap that is corrected once can return through starting offers, performance ratings, or promotion outcomes if those decisions are not controlled. Sustainable pay equity comes from making review points part of the compensation cycle, so leaders evaluate the process itself rather than treating the result as a one-time fix.
Build the controls into the process
The strongest organizations connect pay equity checks to objective setting, performance review, and reward approval. That linkage matters because manager discretion often varies by team, role, and employee profile, even when salary bands appear consistent on paper.
Regular monitoring also needs clear reporting rules. Leaders do not need to publish every internal detail, but they do need a stable method for explaining what the organization measures, what it excludes, and how it responds when a gap remains. That approach supports trust with employees and gives legal and compliance teams a consistent record.
The EU context is moving in that direction, and the CSRD and litigation context shows why reporting discipline can have downstream legal effects. For HR teams, weak data governance in compensation is not only an analytics problem, it can become a governance problem.
Where systems beat slogans
Pay equity lasts when it becomes part of routine management, not a special project. Objective goal-setting, consistent evaluation standards, promotion checks, and review gates before compensation decisions are finalized all reduce the risk of hidden drift.
- Review promotion criteria: Make advancement rules legible and consistent across teams.
- Audit starting salaries: Check whether new-hire offers drift by gender, function, or location.
- Track variable pay: Verify that bonus and incentive rules do not reward access as much as performance.
- Report consistently: Use the same definitions each cycle so changes are comparable over time.
If the metric changes every quarter, the organization cannot tell whether the gap is improving or whether the measurement has moved.
Spark supports that operating model by connecting performance management, KPI tracking, and compensation workflows in one place, which makes it easier to review pay decisions alongside objective goals and reward allocation. For HR directors, that distinction matters: it separates a one-time correction from the system that keeps reproducing the gap.
If your team needs a cleaner way to measure the gender pay gap, separate raw from adjusted views, and keep compensation decisions tied to objective criteria, visit Spark and see how a unified performance and reward workflow can support that work. It gives HR and People teams a practical structure for tracking the metric, documenting rationale, and keeping pay equity reviews inside the same operating rhythm as performance management.